Call it what you like – textbook profit taking, reversion to the mean, or simply a long-overdue correction – but there is nothing really surprising in the way the KSE100 Index is consolidating.
Because, however you see it, the bull run that began in mid-2023 and lasted throughout 2024 had taken the Index ahead of itself – not so much in regard to the level it reached as the speed with which it has risen.
Hence the natural adjustment that is playing out right now.
And while all sorts of indicators were screaming for days and weeks that the market was extremely overbought, you only need to analyse the following few to put two and two together and understand what is really going on.
1. At its highest high, which was recorded at 118,735.10 on 6 January 2025, the Index was more than 30 percent above its 200-day moving average (see chart).
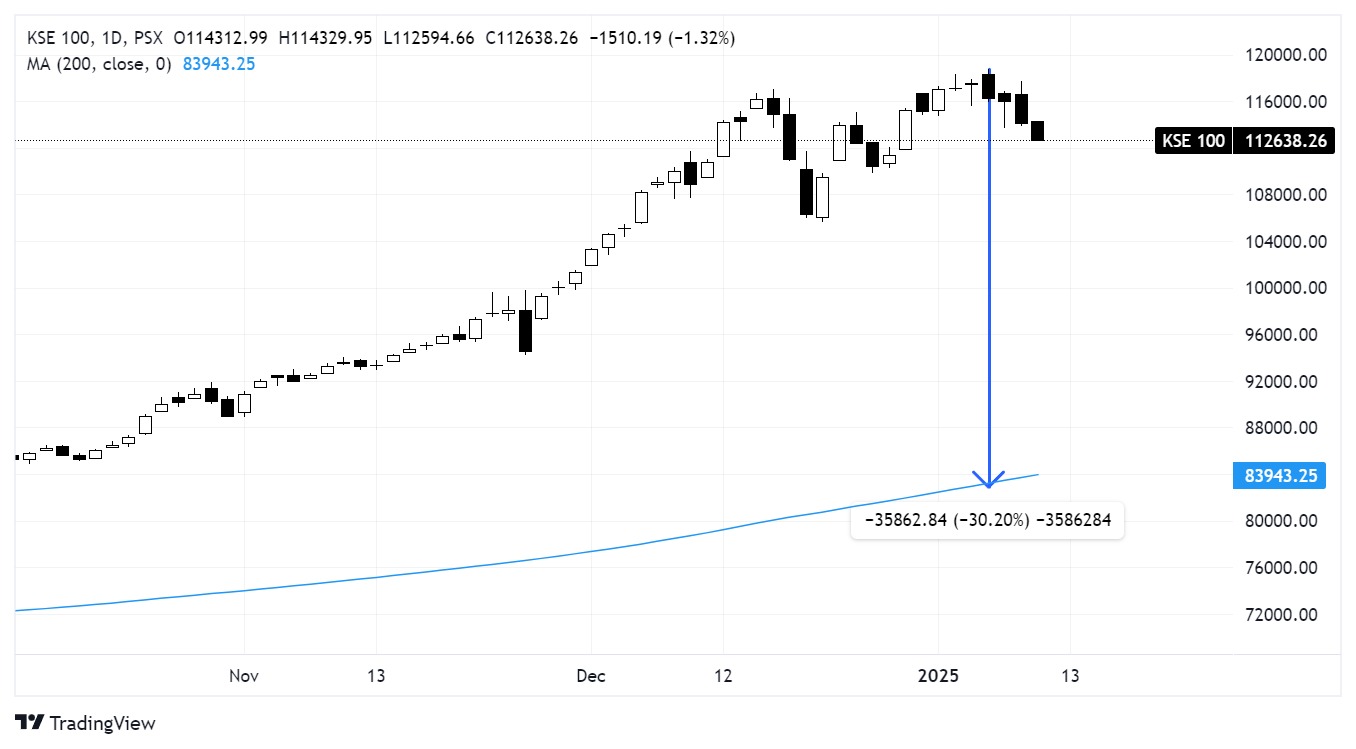
For perspective, the NASDAQ100 Index (NDX) -- which includes the 100 largest non-financial companies listed on the NASDAQ stock exchange, making it a key indicator of the performance of the tech sector and the broader market -- was less than 5pc above its 200-day moving average when it made its highest high on 16 December 2024.
2. As of 8 January 2025, the number of stocks that moved above the 200-day moving average was 2, while the number that moved below the 200-day moving average was 8, showing a market that is losing momentum (https://pkfinance.info/screener/preset?screenerType=by200d).
3. Similarly, the number of stocks that’s moved above the 100-day moving average was 4, while the number that’s moved below it was 22 (https://pkfinance.info/screener/preset?screenerType=by100d).
4. The number of stocks making a 52-week high as the Index roared upwards reached 42 on 31 December 2024, 45 on 1 January 2025 and dropped to 12 on 7 January 2025, indicating a clear bearish divergence with the Index and putting the correction in perspective.
More on this in subsequent blog posts!
The big question now, which is all the rage at the stock exchange, is whether this is a small correction that pulls the Index down only to make a higher low before it resumes the uptrend or if it’s a change of the secular trend.
Each week we will analyse these and more indicators to gauge the strength and breadth of the market to help answer this question till the larger trend becomes clear.
Disclaimer: This content is for educational and informational purposes only. It should not be considered financial or investment advice. Always do your own research or consult with a licensed financial professional before making any investment decisions.

.png "What Is an IPO in the Share Market?")
.png "AI in PSX: The New Research Analyst Who Doesn’t Need Tea Breaks")