
It’s interesting how many times over the bull run of the last year and a half the KSE100 Index has found support on the 20-day EMA (Exponential Moving Average).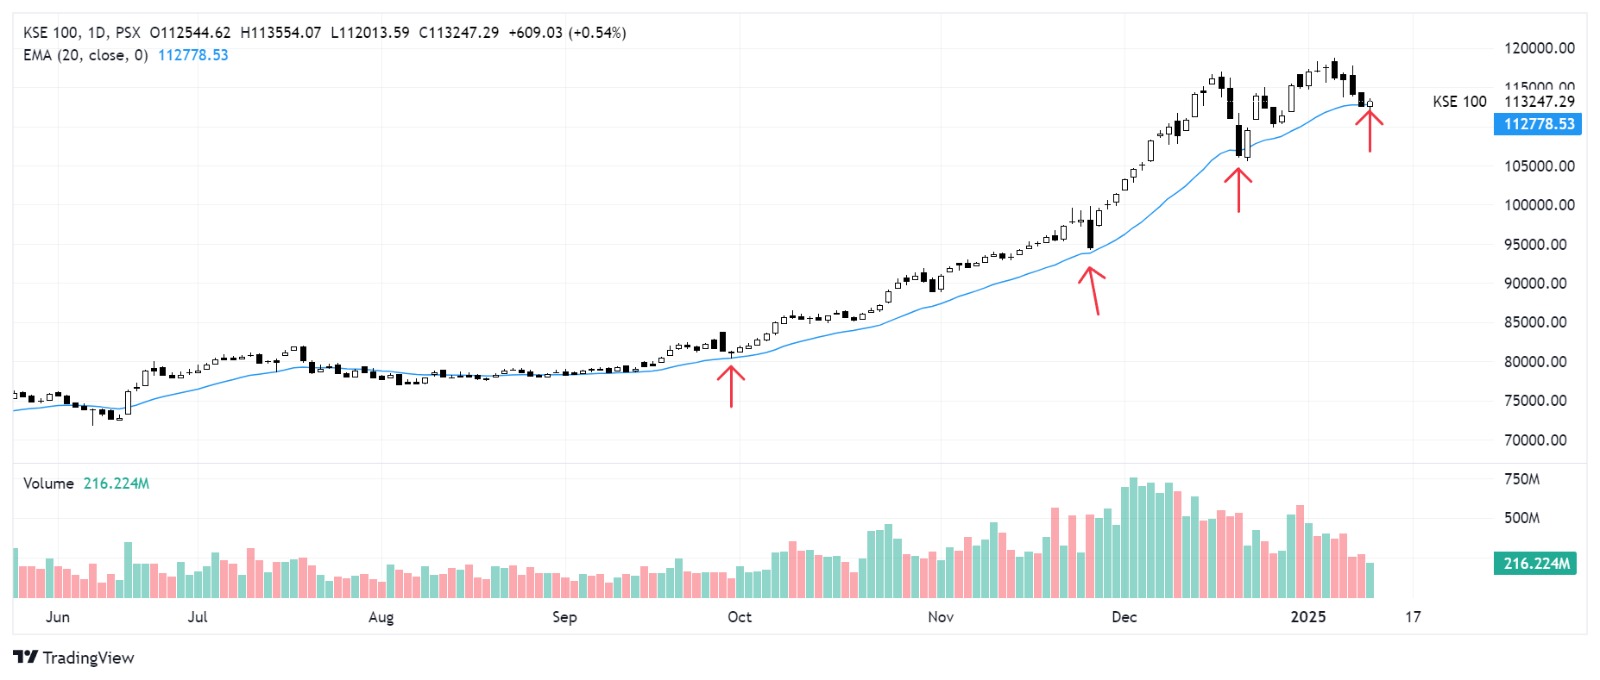
It did in December, November, throughout August-September, July, June, and so on and so forth.
And it did it again on Friday, 10 January 2025, the only day of the last week when the market ended in green after four consecutive sessions of hemorrhaging. That must have got eager bulls hoping for a repeat of the 19-20 December 2024 fakeout/false breakout that made a higher low and resumed the uptrend, albeit a much weaker one.
The subsequent top, made on 6 January 2025, was only marginally higher than the previous high on 17 December 2024, implying that the market has lost considerable momentum; hence the speculation about a turn in secular trend itself.
One time-tested way to measure Index strength is to gauge the number of stocks making 52-week highs. This number rose along with the Index and peaked at 90 on 5 December 2024. Then, after some fluctuation, it ended last year with 42 on 31 December, started the new year with 45 on 1 January, and had dropped all the way to only four on 10 January.
Now, as trading resumes on Monday, 13 January 2024, we’ll be keeping an eye on both the Index’s interaction with the 20-day EMA and the number of stocks making 52-week highs throughout the week. Then we’ll make comparisons with the previous week.
Market turns, especially after steep rises like the one KSE100 witnessed over the last year and a half, are characterised by rush to look for past patterns to explain more recent behavior.
At YMS Securities, we’re monitoring many indicators and patterns, which we’ll share in these blog posts every week.
Stay tuned.


