Price patterns, whether within a single chart or across scrips, even sectors and indices, are the life and blood of technical analysis. Yet sometimes some patterns reveal a lot more than just strength and weakness of trends for buy and sell signals, they add to the knowledge bank about the interaction between various indicators and patterns.
Today, 8 September 2025, is turning out to be just such a day as the KSE100 index roars past the 156000 barrier.
There’s almost unanimous confirmation among technical analysts that of all the indicators and oscillators in their toolkit, volume is the one true leading indicator. And, with the 100 index making higher-high after higher-high, it’s only natural to take cue from volume across sectors, add on to long positions, and laugh all the way to the bank.
Turns out it’s not always the case.
Today, interestingly, the top volume shares of each of the top five leading volume sectors either just stalled or failed at resistance—except for one. Only KEL broke and closed above resistance. Let’s look at them one by one.
1. Sector: Cement | Stock: DCL
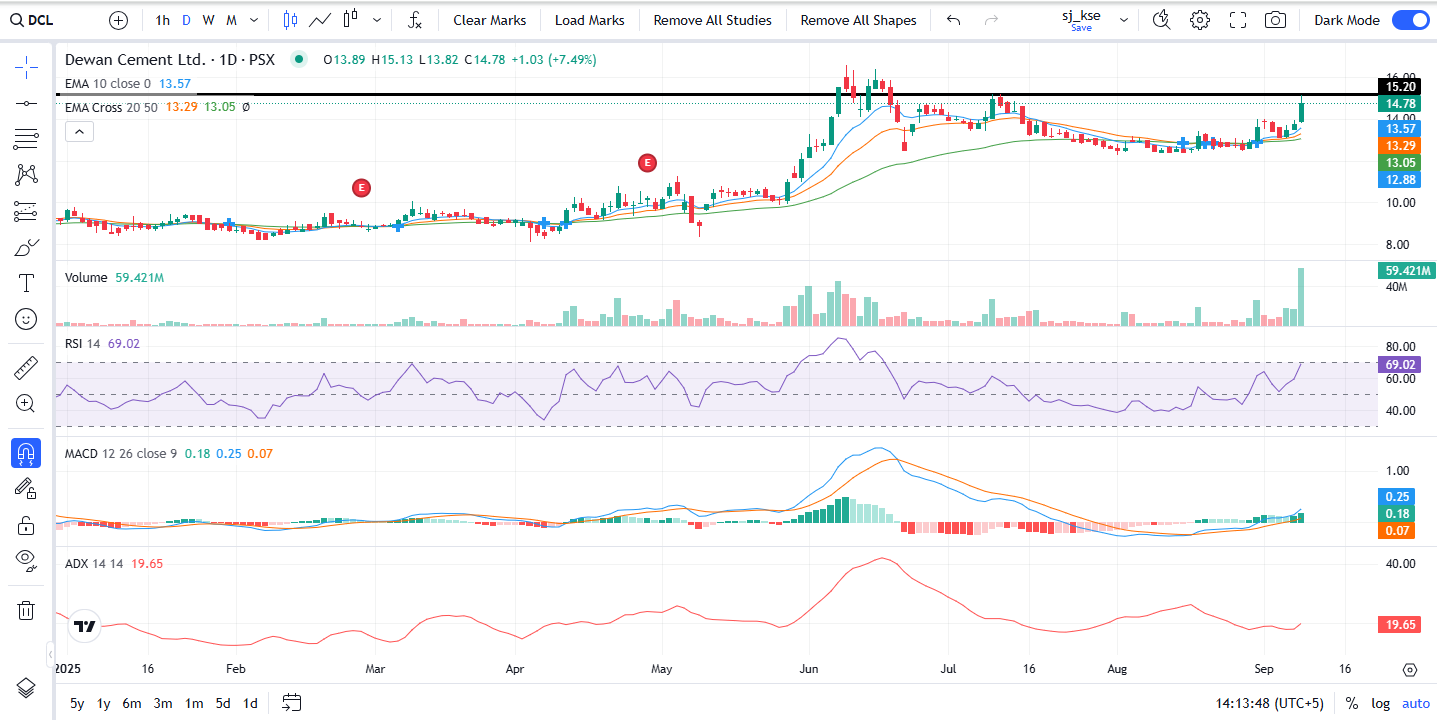
Cement is top volume sector and DCL the top volume stock in it for the day. Looking closely at the chart, you’ll have to go back years to find DCL trading with such high volume (59.2m). And, you’ll also see how the start worked perfectly, with a strong bounce off the EMA cluster, until the stock hit resistance at around 15.20, the Jul 10 high.
2. Sector: Commercial Banks | Stock: BoP
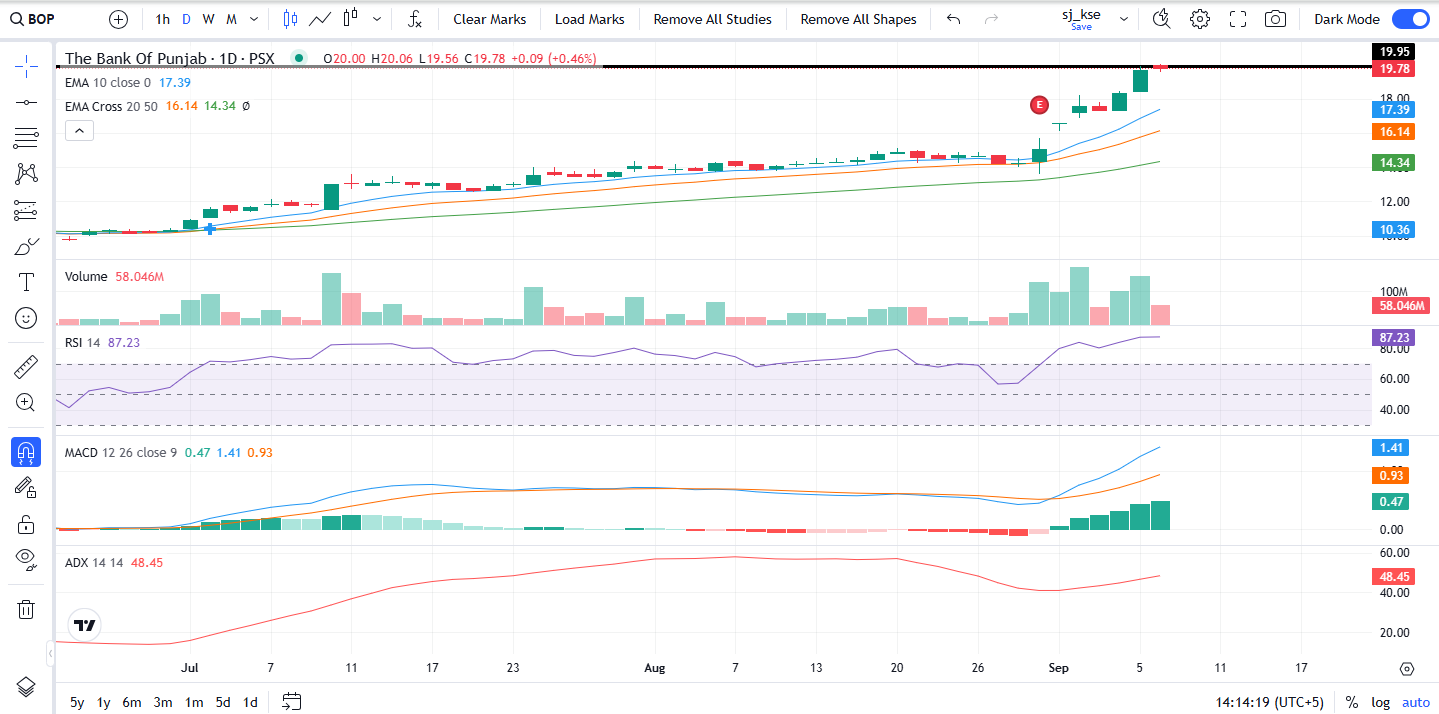
BoP’s volume for the day, 57.6m, is very low by its own historic standards, but it is number one in the commercial banking sector, the sector with the second highest volume for the day.
And it’s clear that the stock barely budged today, even unable to move above yesterday’s high convincingly.
3. Sector: Power Generation & Distribution | Stock: KEL
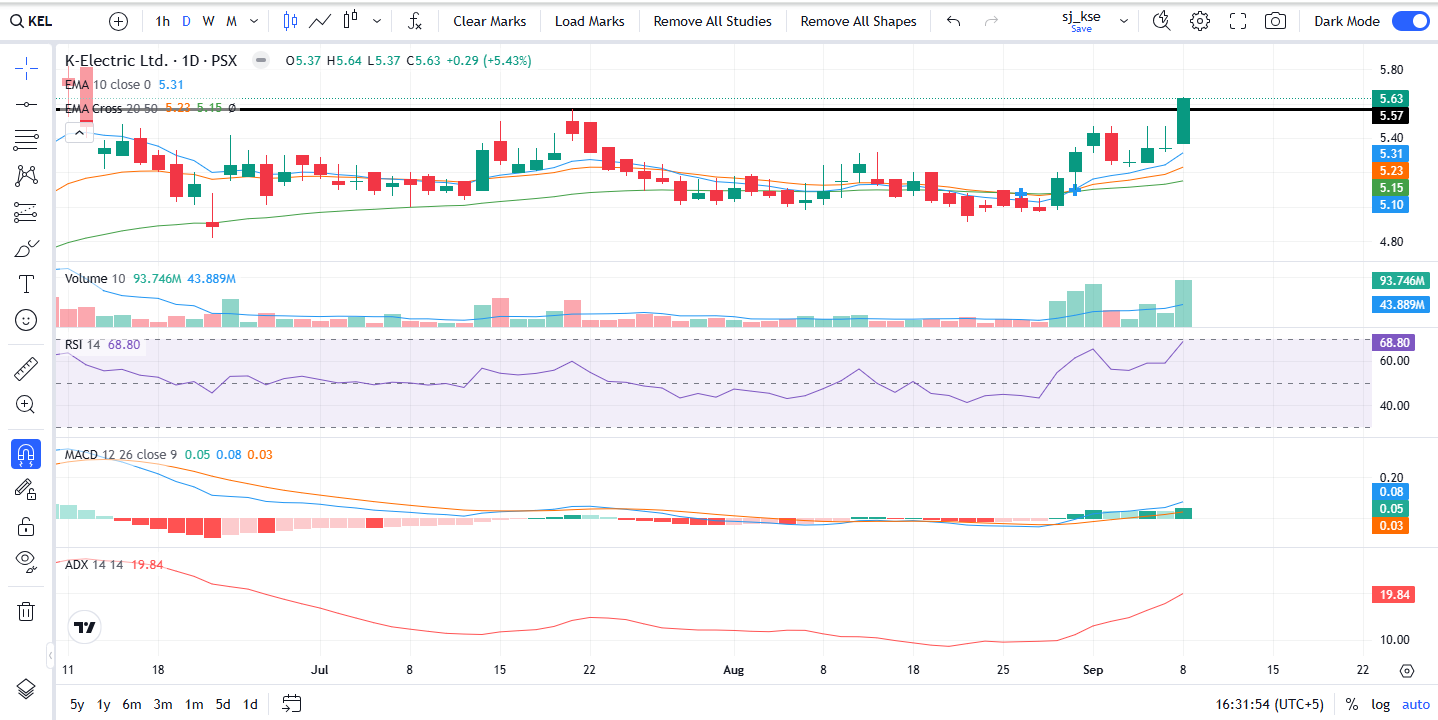
KEL’s 56.6m turnover was modest by its own norms, but unlike peers in other sectors, it broke through resistance at 5.57 and closed above it. This makes it the day’s only successful breakout, backed by heavy participation.
4. Sector: Technology & Communication | Stock: TPL
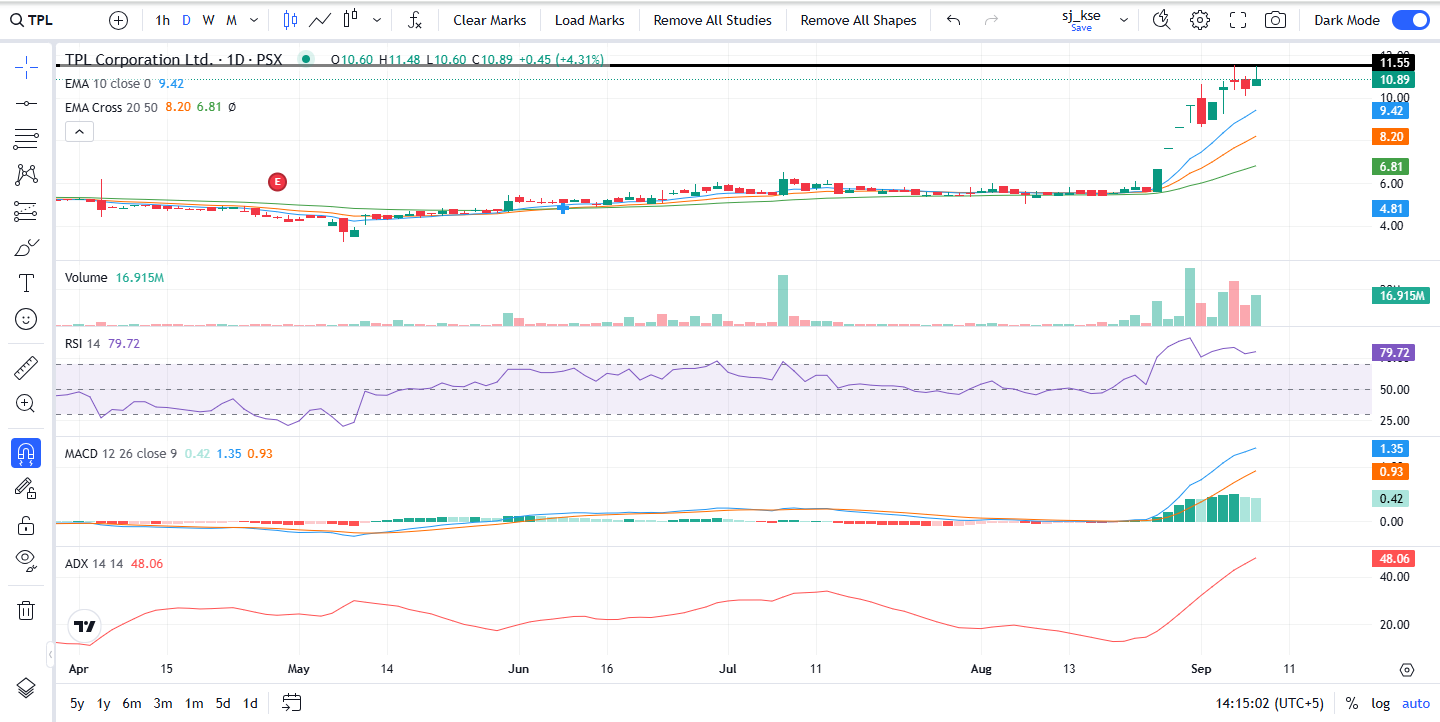
Historically, 16–17m is moderate volume for TPL Corporation. And a similar story here, only that resistance was just from two trading days ago. The rally stalled on contact.
5. Sector: Food & Personal Care Products | Stock: FFL
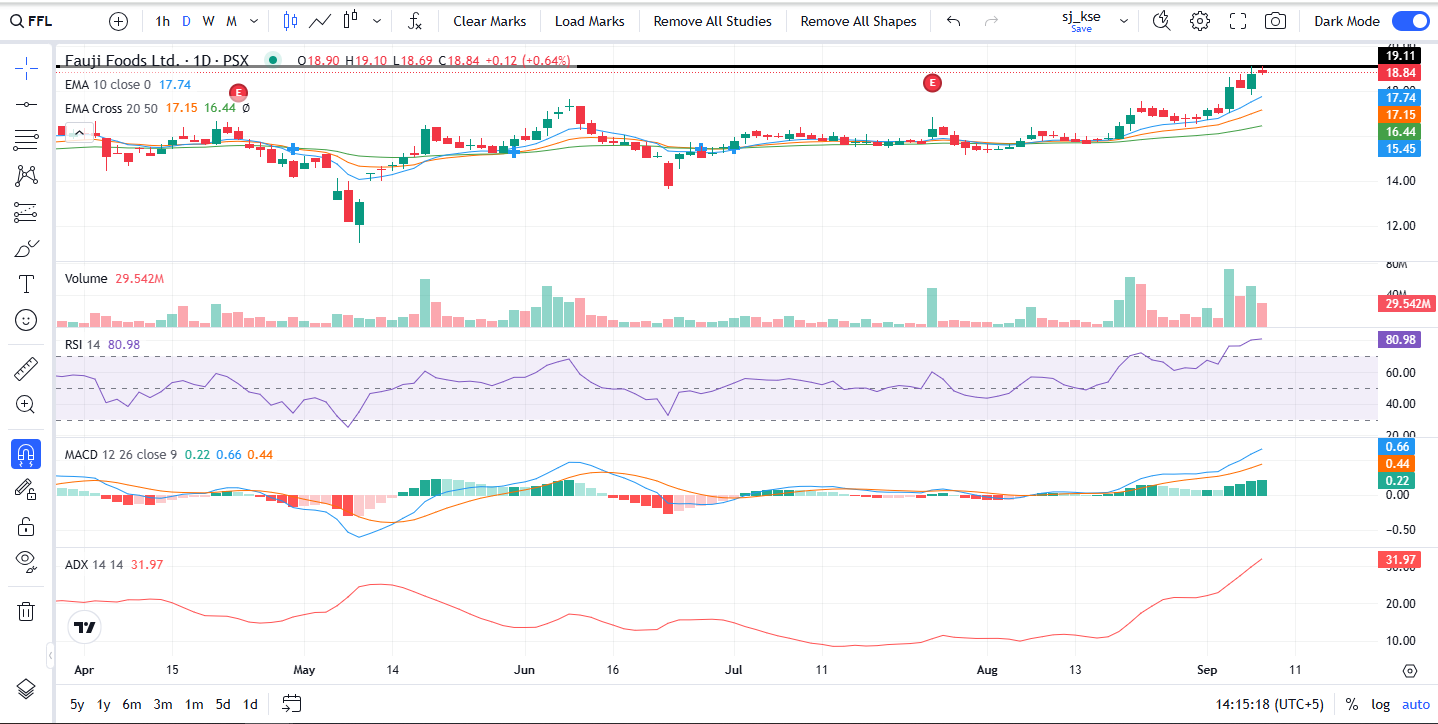
29–30m is average volume for FFL. And its chart for the day almost mirrors BoP’s from Commercial Banking. A small spinning top unable to really move above the previous day’s high.
Understanding and interpreting such patterns, especially as the market goes deeper into uncharted territory, is key to employing technical analysis correctly. Such data also goes to show why experienced chartists tend to wait for close above resistance before issuing a buy call.
Volume is one true leading indicator, no doubt, but the final decision should come after the volume–resistance duel is complete. And as today showed, only KEL passed the test.
.png "Oil & Gas Marketing Sector: What the Numbers Are Really Telling Us")

